Real-Time Partner Analytics — From Engagement to Revenue
Know exactly which partners are active, which deals are in flight, and which programs are generating revenue — all in a live dashboard updated in real time. No spreadsheets, no guesswork.
What are Partner Performance Dashboards?
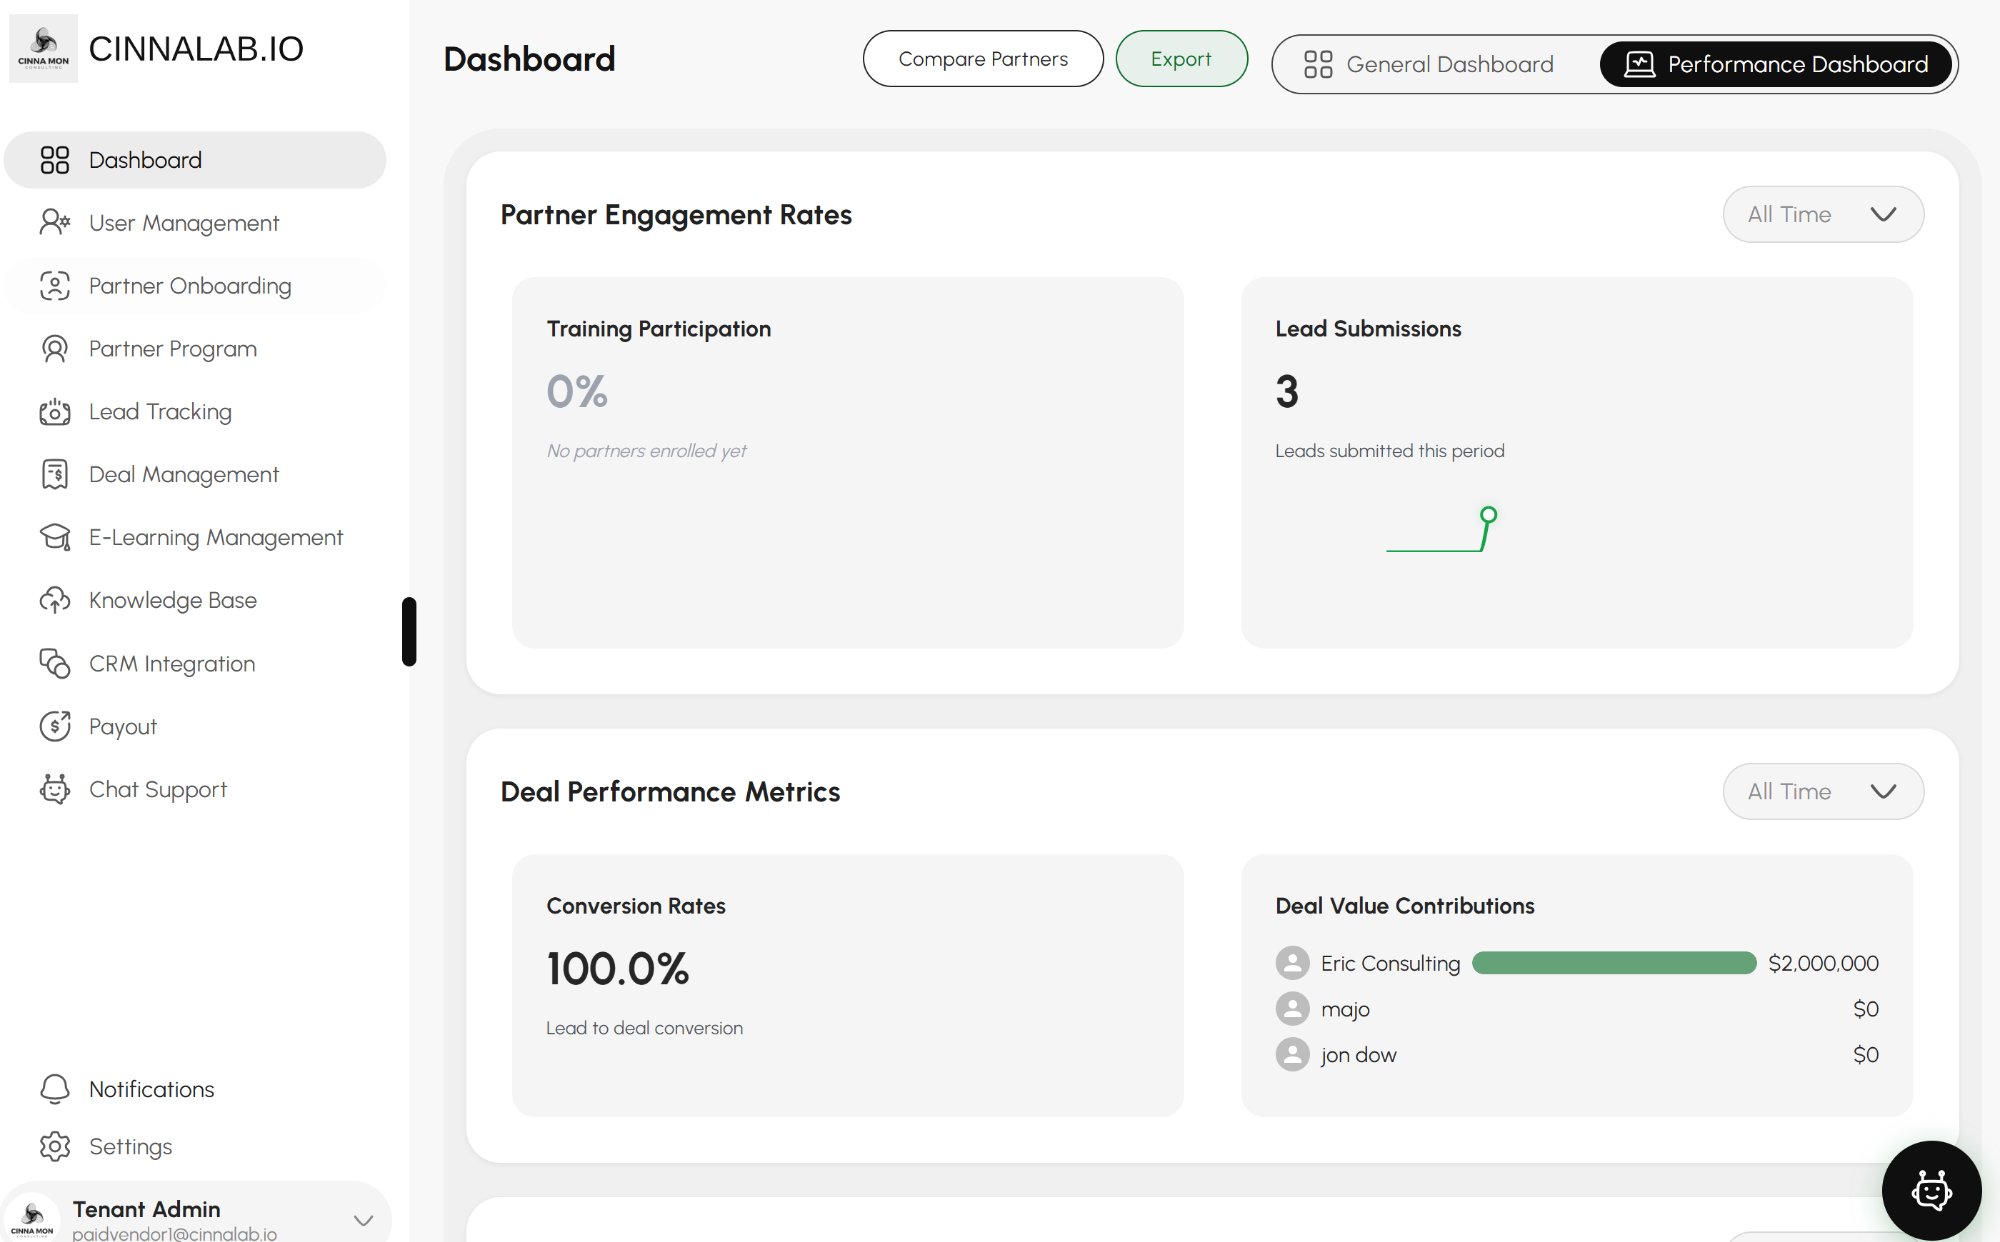
CinnaLab.io's Performance Dashboards give you a real-time view of your entire partner ecosystem — from onboarding completion rates to deal pipeline value to revenue attribution by partner. All data is live, exportable, and filterable.
Partner programs without structured analytics operate on gut feeling. CinnaLab.io replaces partner status spreadsheets with a single source of truth — giving your team, your leadership, and your CRO the partner revenue visibility they need to make data-driven decisions.
Your Whole Ecosystem at a Glance
The General Dashboard surfaces the most important partner program metrics immediately — total partners, onboarding completion rates, active deals, pipeline value, and recent activity — so you can assess program health in seconds.
- Total partner count by program, tier, and status
- Onboarding completion rate and average time-to-activation
- Active deal count, pipeline value, and close rate
- Partner activity in the last 7, 30, 90 days
- Top performing partners by revenue contribution
- Alerts for inactive partners, expiring certifications, and stalled deals
Compare Partners Side-by-Side — Identify Your Best Performers
The Partner Comparison view lets you rank and compare partners by any metric — deal volume, conversion rate, training completion, revenue contribution. Identify top performers to invest in and underperformers that need re-engagement.
- Side-by-side partner performance comparison
- Rank by revenue, deal volume, conversion rate, or activity
- Filter by program, tier, region, or time period
- Partner health score combining multiple engagement signals
- Export comparison data to CSV for executive reporting
- Identify partners ready for tier promotion
Dashboard Views
Six Dashboard Views for Every Role
General Dashboard
High-level program health. Total partners, pipeline, active deals, and onboarding completion rates. Perfect for daily team check-ins.
Deal Performance
Conversion rates, deal velocity, average deal value, and closed revenue by partner and program. The revenue leader's go-to view.
Partner Engagement
Training participation, chatbot usage, portal login frequency, and communication response rates — the leading indicators of partner success.
Task Completion
Onboarding task completion rates across your partner network. Identify which steps are causing friction or delays in the activation journey.
Partner Comparison
Rank any set of partners against any metric. Use for QBR prep, tier promotion decisions, and identifying underperformers who need intervention.
Commission & Payout
Outstanding commission calculations, payout history, and partner earnings by deal. Full transparency for partners and finance teams.
FAQ
Analytics & Dashboard Questions
Yes. CinnaLab.io dashboards reflect the current state of your partner data — onboarding progress, deal submissions, and partner activity update immediately as events occur. There is no batch refresh delay.
Yes. All dashboard views support CSV export. You can export partner lists with full performance metrics, deal pipeline data, commission reports, and training completion records for use in external reporting tools or executive presentations.
Yes. Partners see their own performance data in their portal — their deal submissions, pipeline value, training completion, and commission earnings. They cannot see other partners' data.
Yes. You can configure alerts for key events — partner inactivity thresholds, deals stalled for too long, certification expirations, and partner tier promotion readiness. Alerts are delivered by email to configured recipients.
See Your Partner Ecosystem Clearly
Real-time dashboards. Full attribution. Start free.
Or email us at support@cinnalab.io